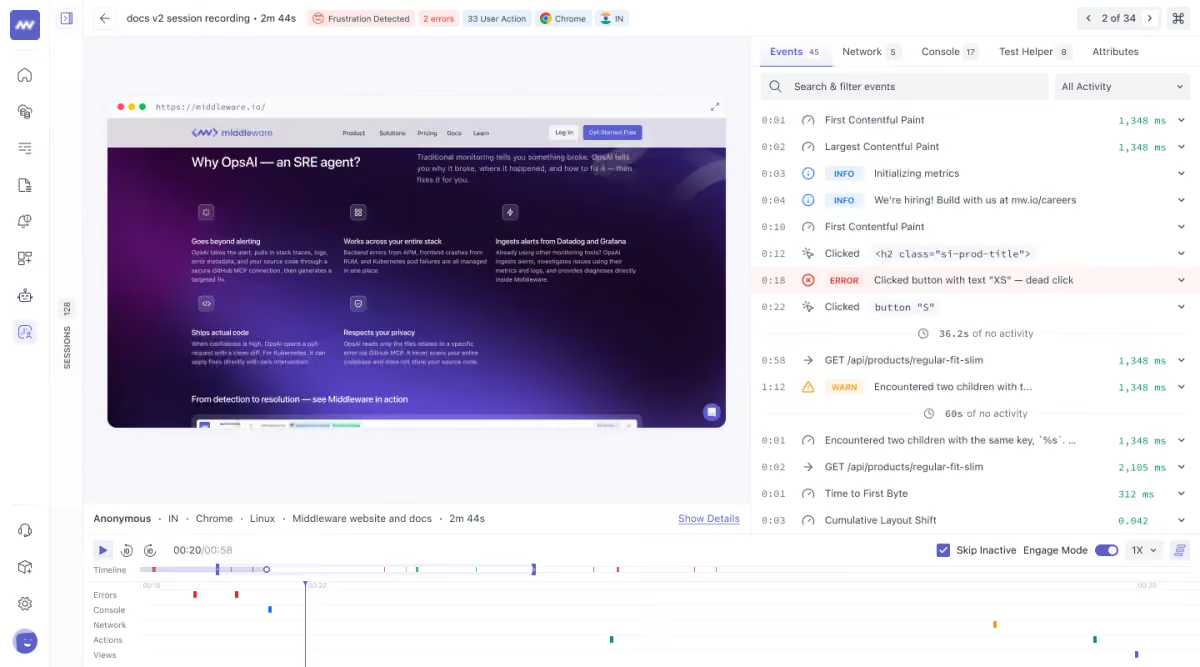
Observability vendor Middleware has rolled out a significant upgrade to its Real User Monitoring (RUM) Session Explorer, aimed at cutting the time it takes engineering teams to trace user-facing issues back to their root cause. The update looks like a routine feature release, but it fits a broader pattern reshaping how web teams debug production issues: the collapse of previously siloed tools — session replay, error tracking, and distributed tracing — into a single working view.
What RUM Actually Solves
Real User Monitoring captures performance and interaction data directly from real visitors’ browsers rather than relying on synthetic tests or lab conditions, giving teams a live picture of how people are actually experiencing a site so problems can be caught before they compound. Middleware’s dashboard reflects that philosophy directly — instead of parsing aggregate charts after the fact, engineers watch individual sessions stream in as they happen, which is what turns RUM from a reporting tool into a debugging one.

What’s Changing in the Session Explorer
According to Middleware’s release notes, the updated Session Explorer adds:
- A unified replay view — session recordings now sit alongside events, network requests, and console logs in one timeline, instead of requiring separate tabs or tools
- Mid-session jumping — engineers can select a time range inside a long recording and immediately inspect what happened during that window, rather than scrubbing through the entire session
- Trace and error correlation — the full backend trace or frontend error tied to any event opens directly from the session view, without switching screens
- Faster session-to-session navigation — teams can move to the next relevant session without returning to the sessions list each time
- Cross-signal correlation — user actions can now be lined up against Web Vitals, long tasks, network calls, and console errors to spot what triggered a performance dip or functional bug
- Better triage tools — session filters plus error and “frustration” signals (such as rage clicks) help teams jump straight to the sessions most relevant to a reported issue

Why This Fits a Larger Trend
The push toward correlation isn’t unique to Middleware. Independent reviews of RUM tools increasingly point to backend correlation — tying frontend sessions directly to traces and logs — as a key differentiator, alongside features like source-map support that trace minified JavaScript errors back to exact lines of code. The problem this solves is a familiar one for engineering teams: investigations built on scattered, disconnected signals tend to drag on, and by the time a root cause surfaces, user impact has already spread.
Consolidation, in other words, isn’t a nice-to-have anymore — it’s becoming the baseline expectation. Vendors that once specialized narrowly in session replay, APM, or log management are increasingly bundling all three, betting that engineering teams would rather work inside one correlated dataset than stitch together findings across multiple dashboards mid-incident.
The Practical Upshot
For teams already running Middleware, the update mainly removes friction — fewer tab switches, fewer manual timestamp lookups, faster handoffs between frontend symptoms and backend causes. For the wider observability market, it’s another data point in a trend worth watching: as applications get more distributed and tolerance for slow or broken experiences shrinks, the tools built to debug them are converging rather than specializing further.
Full details available here .


No responses yet